

All the metrics are calculated and displayed in the App’s Timezone.
Overview
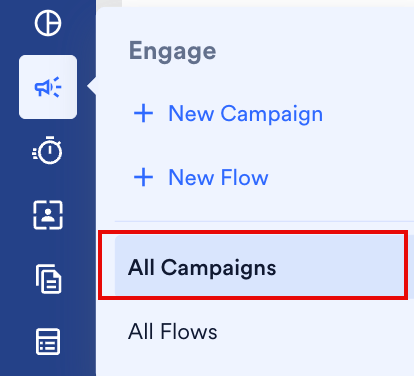
Navigation:- On the sidebar menu in MoEngage, hover over the Engage icon
 . The Engage menu appears.
 - Click All Campaigns.
- Click the row that displays the information about the campaign for which you wish to see the analytics information.
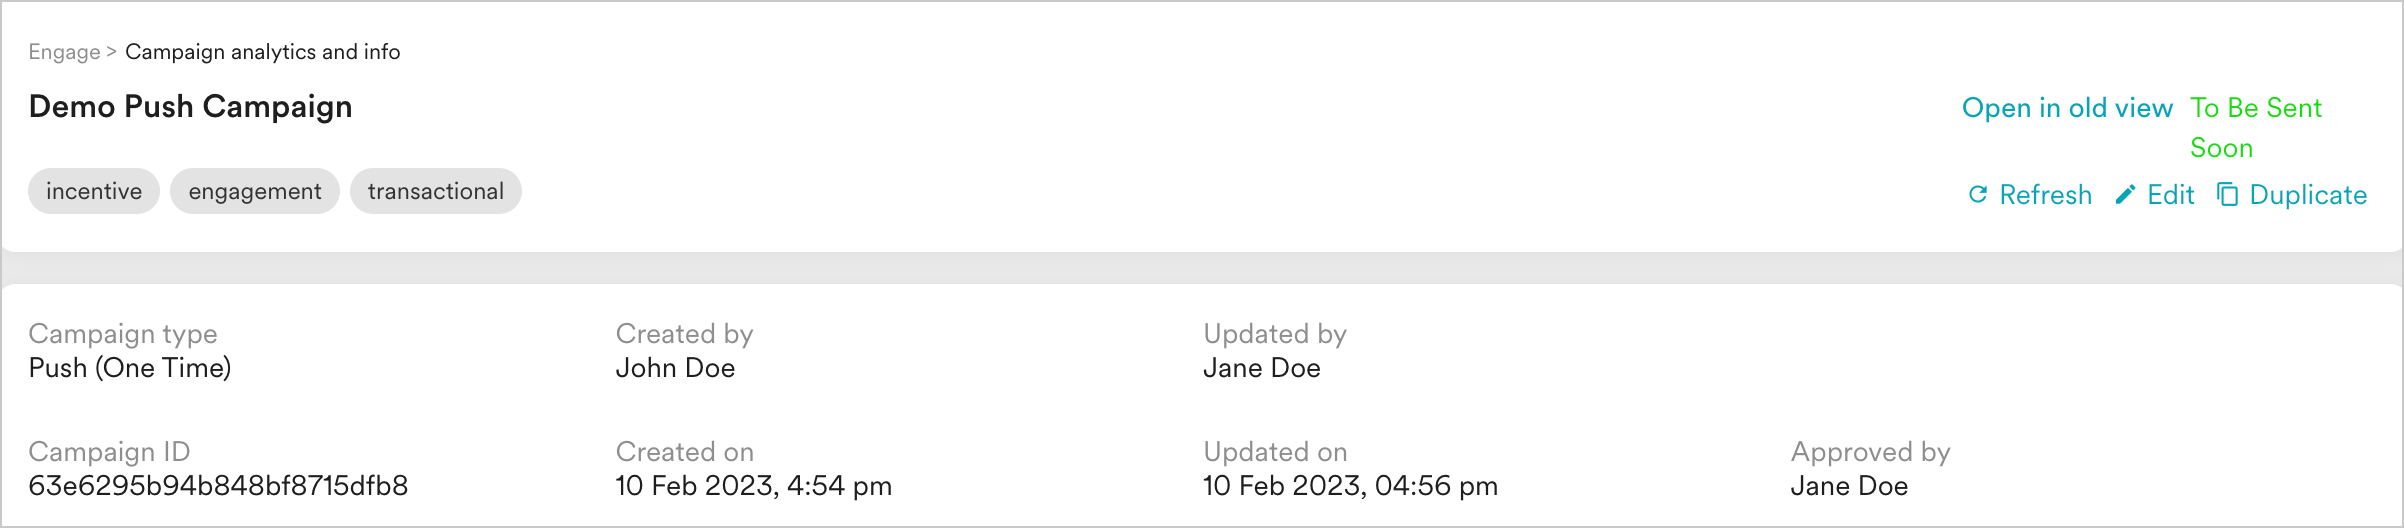
- Campaign Details - contains information about the campaign and its status. For more information, refer to Campaign Details.
- Analytics - contains information about the various metrics that are tracked for the campaign and has the following sections:
- Info- contains information about the campaign’s target segment, channel-specific information, content, preview, and delivery schedule. For more information, refer to Campaign Info.
Campaign Details
This section contains the following information:- Campaign type
- Campaign ID
- Campaign creation and updation details
- Team information
- Approver’s list/ Approved by/ Rejected by (if CAF is enabled)
- Campaign status - A campaign can have the following states: Active, Expired, Not Sent, Paused, Scheduled, Sending, Sent, and Stopped. If Campaign Approval Workflow (CAF) is enabled, two more states are possible for campaign status: Under_Review_ and Rejected.
Campaign Analytics
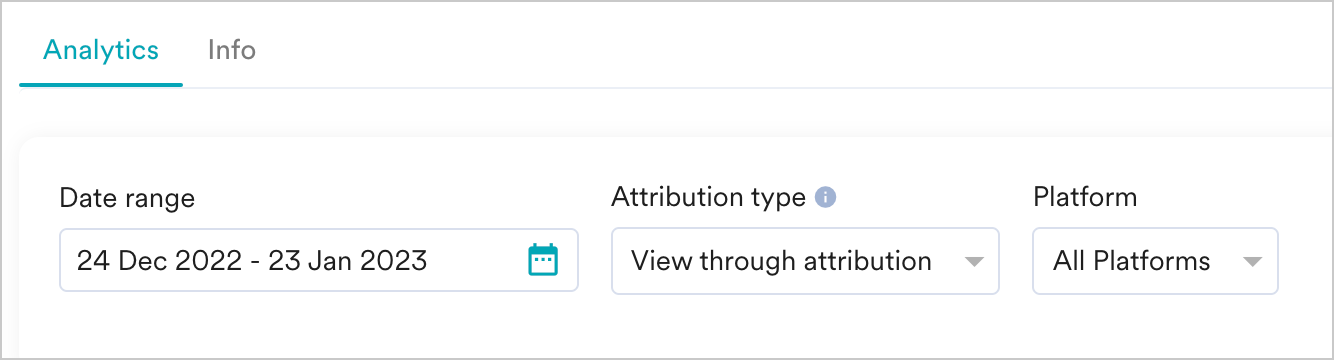
The analytics section contains information about the performance stats and revenue metrics. Global Analytics Filters These filters are applied to all the sections in the Analytics tab.- Date Range- Select the date range for which you want to view the performance stats.
- Attribution Type- Select the attribution type (Click through, In-session, and View through) to view the analytics information for the specified attribution type. The default attribution type is View through attribution. Refer to the paragraph below for information on attribution types. For more information, refer to the paragraph below.
- Platform- Select the platform for which you want to view the performance stats. The default is ‘All platforms’ in case the campaign is targeting multiple Platforms.
- User A clicked on the message and did the conversion event within 30 minutes (we assume it to be the same session) of clicking.
- User B clicked on the message and did the conversion event 2-3 hours after clicking.
- User C saw your message, later launched the app directly, and made the conversion.
Attribution Window - Attribution Window is the duration calculated from the time a user receives or clicks the campaign having specific conversion goals. For example, two campaigns with a conversion goal as a purchase are created. Campaign C1 at time H hours and campaign C2 at H+12 hours. The customer achieves the conversion goal for purchase with the campaigns C1 and C2 at time H+15 hours. The conversion of customers is attributed both to C1 and C2.
In MoEngage campaigns, the maximum attribution window is 36 hours. When you send more than one campaign with a difference of less than 36 hours, then set the attribution window:
- Lesser than 36 hours
- With the duration difference in sending the campaigns.
Campaign Performance Stats
Campaign performance provides the impact of the push campaigns. Some campaigns contain the impact of Push Amplification (Push Amp+ or Push Amp) on these metrics. For more details, please check these articles for Push Amp or Push Amp+.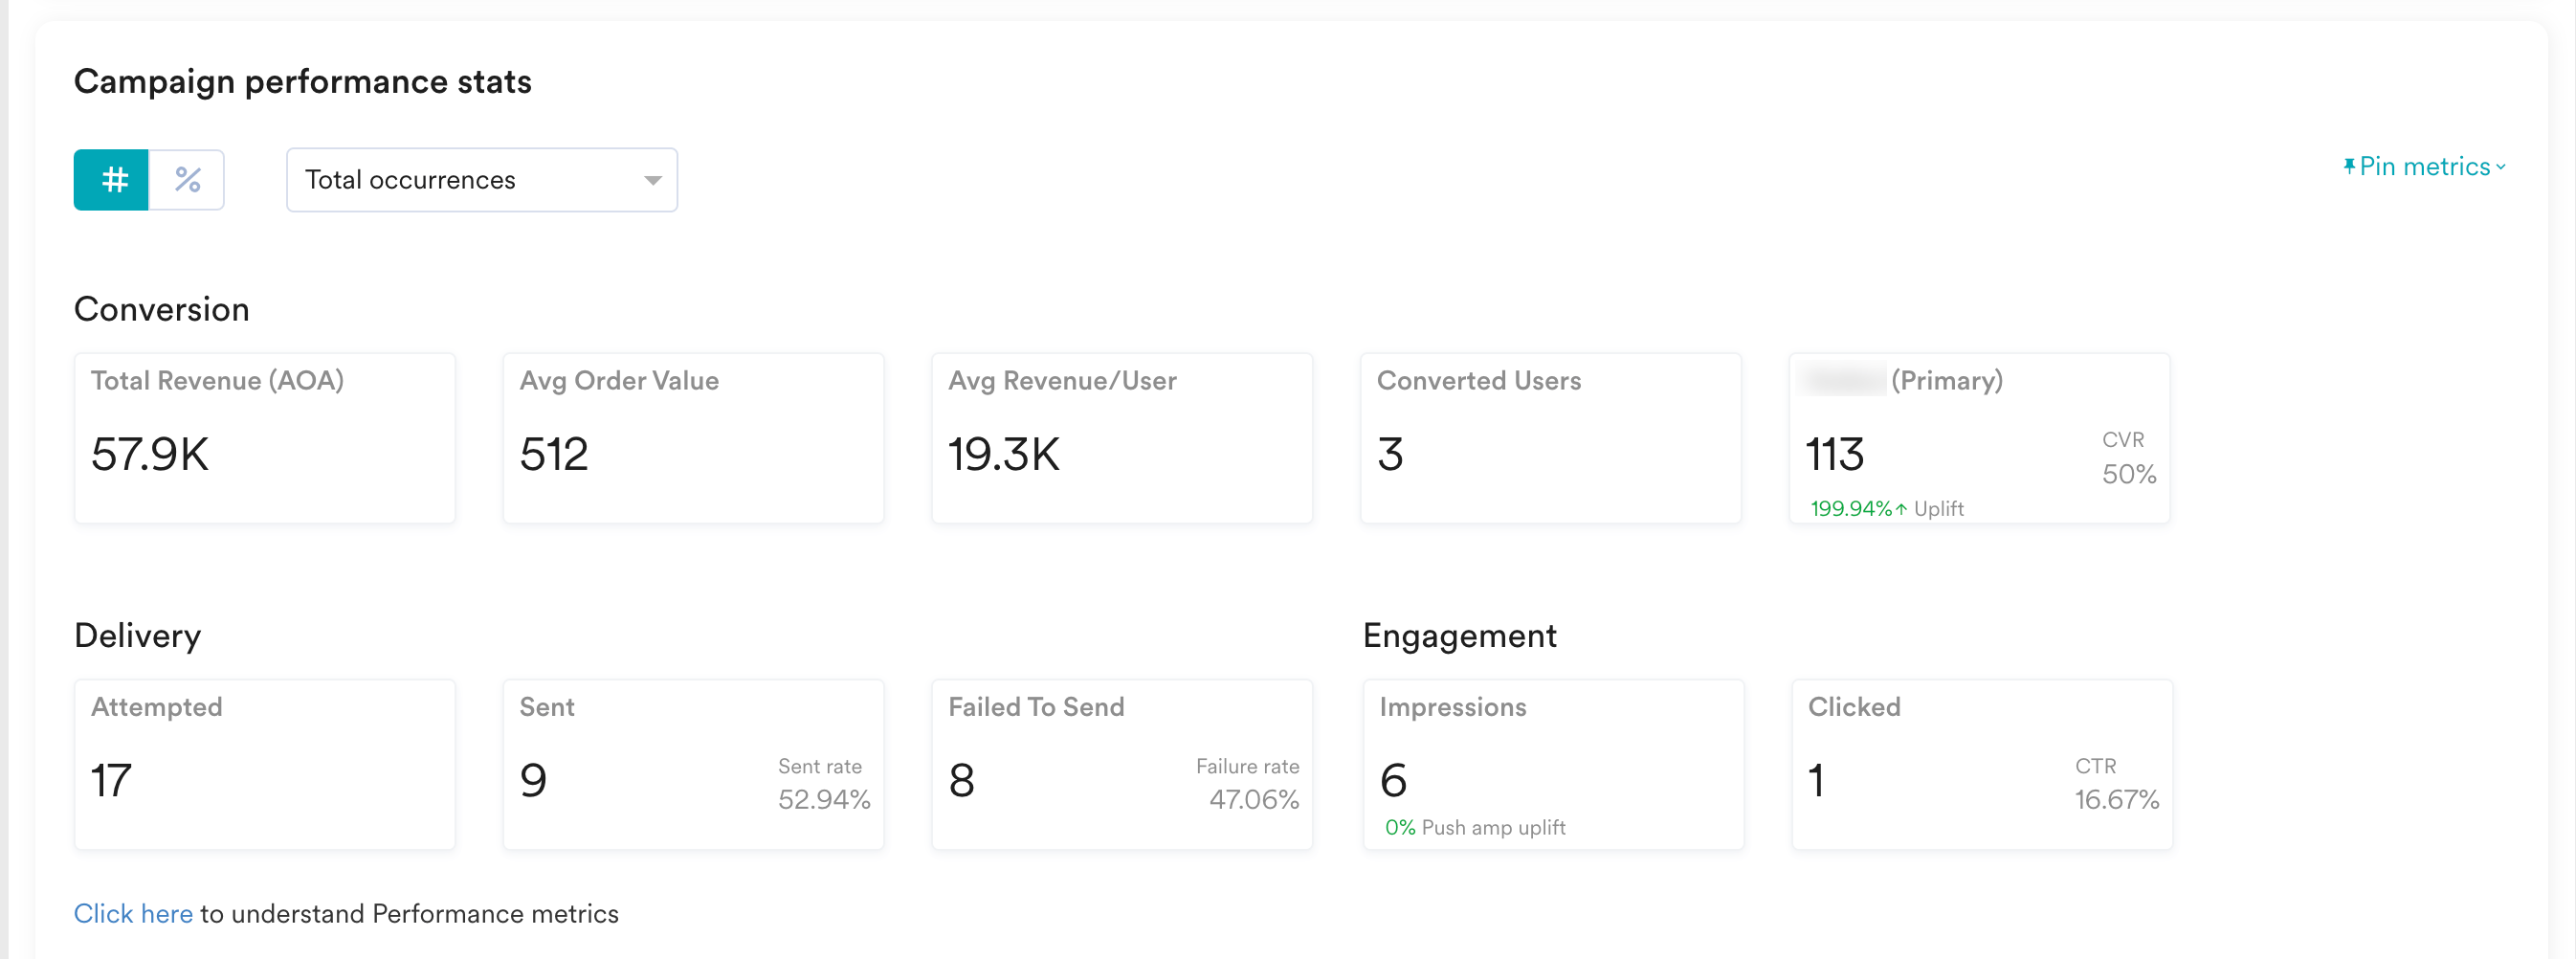
- Choose the number view or the percentage view to see the stats as numbers or percentage values.
- View the unique or total occurrences of stats by selecting Unique or Total in the dropdown at the top of the section.
- Pin metrics - you can pin the metrics you want to see using the Pin metrics dropdown at the top right corner. You can pin up to five metrics. The selected metric pins are available in the Pinned metrics section. Click _Show all metrics_to see all the metrics being tracked for the campaign and Hide unpinned metrics to see only the pinned metrics for the campaign.

- Conversion Metrics- These metrics pertain to the conversion goals set for the campaign. The higher these metrics, the more effective your campaign! The conversion metrics tracked for your push campaigns are shown in the table below.
- Delivery Metrics- Three delivery metrics are tracked for your push campaigns. They are:
- Attempted - This metric shows the number of users who qualified for the campaign and for whom MoEngage tried sending the message. Attempted users count is derived from ‘Active Device Tokens’.
- Sent -This metric represents the Sent rate and shows the percentage of campaigns that were sent out of the campaigns that were attempted to be sent by MoEngage. Sent rate is calculated as (Sent/Attempted)*100.
- Failed To Send - This metric represents the Failed rate and shows the percentage of campaigns that failed out of the campaigns that were attempted to be sent by MoEngage. Failed rate is calculated as (Failed To Send/Attempted)*100.
- Engagement Metrics- Two engagement metrics are tracked for your push campaigns, and they are shown below.
Time Trends
The campaign performance stats are represented graphically (chart view) or in a tabular view in this section. You can:- View the information in the following granularities:
- Hours
- Days
- Weeks
- Months
- Export Chart
- Switch between table and chart view

The attributes used in the trigger for business event campaigns are available in the tabular view (as a separate column) and in the graphical view (listed as a metric that can be seen on hovering over the respective child campaign).
Locale and Variation Performance
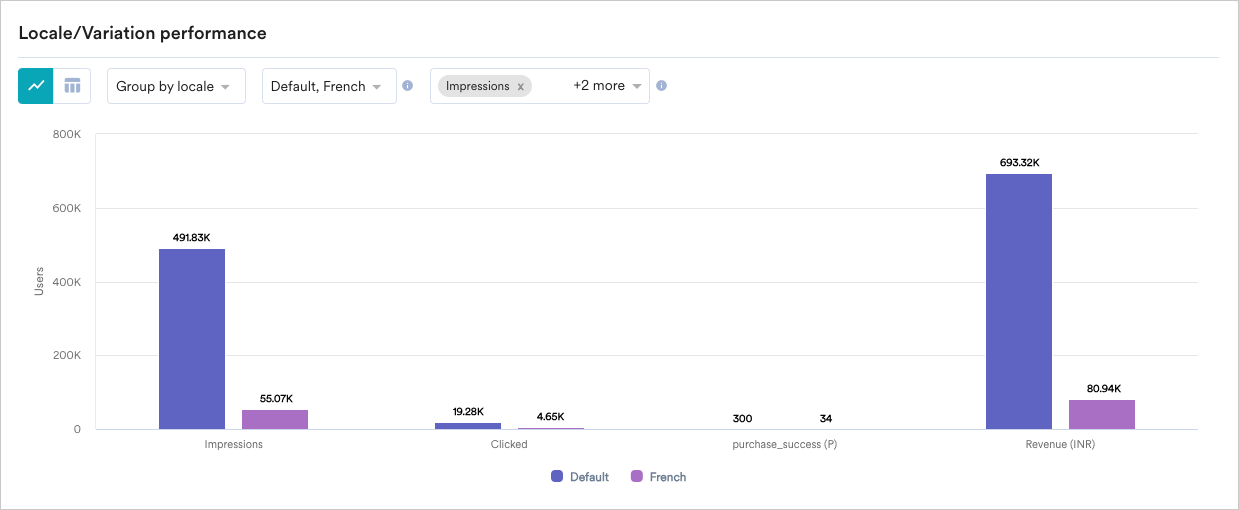
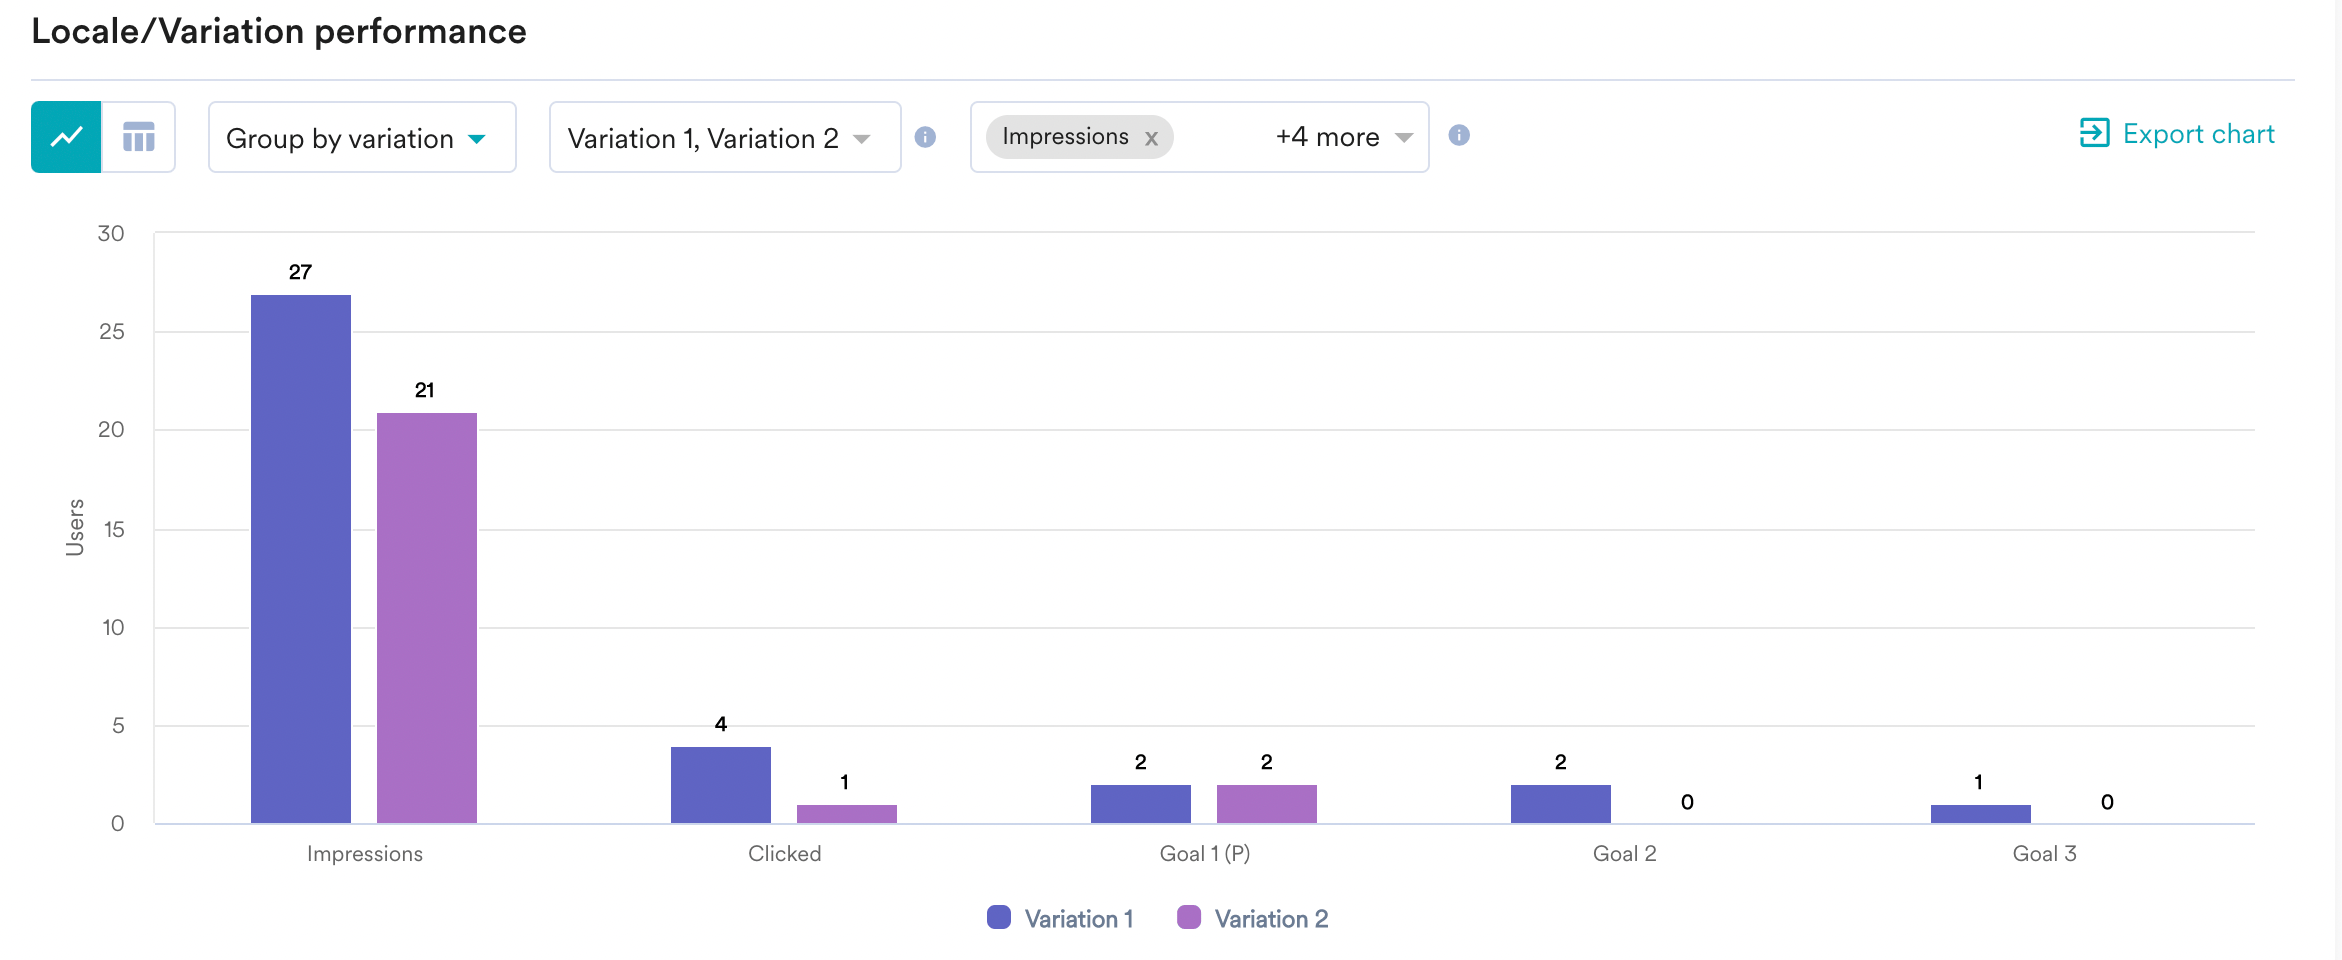
You can see the breakdown of performance metrics (Impressions, Clicks, Conversions, Conversion goals) across each locale (including the default locale) and variation, allowing you to assess and compare the effectiveness of the various locale and variation combinations. You can view the uplift percentage on the tabular view of Locale/Variation performance. For more information, refer to Uplift in Campaigns. You can choose the metrics for which you wish to see the comparison in the metrics dropdown and filter using the following mechanisms:- Group by locale - Lists performance of the metrics selected for each variation grouped by the locale. Hover over the bar graph to understand how each variation has performed for the specified metric in a locale.
- Group by variation - Lists performance of each metric in all locales grouped by the variation. Hover over the bar chart to understand how each locale has performed for the specific metric in a variation.
Conversion Goals Performance
You will be able to see this section when you have set more than one conversion goal for your campaigns. The section compares the performance of goals set by the marketer for the campaign. Total Conversions: Will show all goal events for the respective goals i.e. if a user made a purchase twice, it will be shown twice. It is the equivalent of conversion events covered in the sections above. Unique Conversions: Goals are unique across the users converted per campaign instance. It is the equivalent of the Conversions metric covered in the sections above. You can view the uplift percentage in the tabular view of Conversion Goals performance. For more information, refer to Uplift in Campaigns.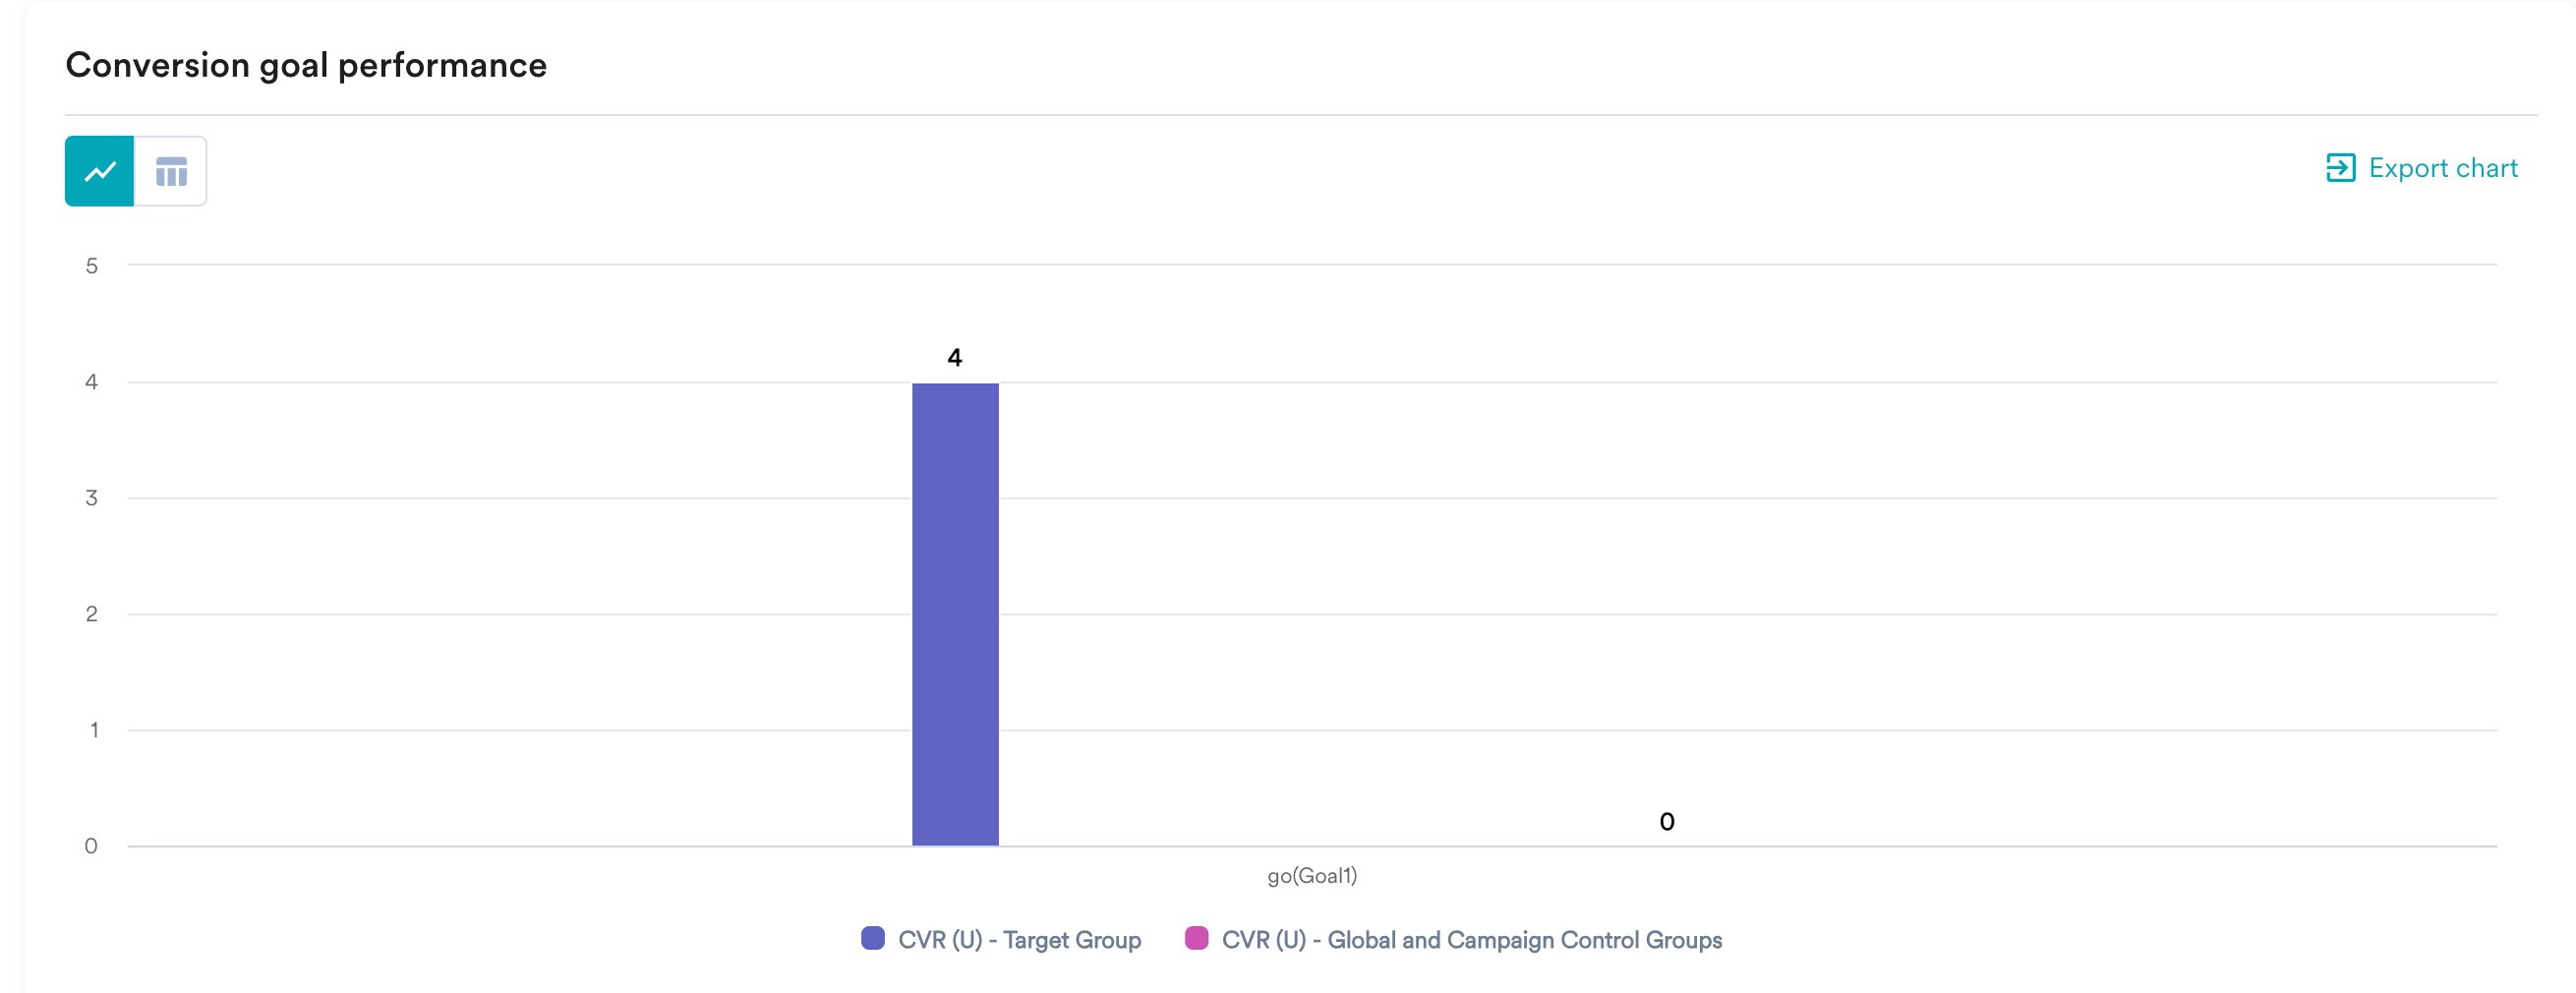
Campaign Delivery
The metrics can be viewed as numbers with the percentages shown above them: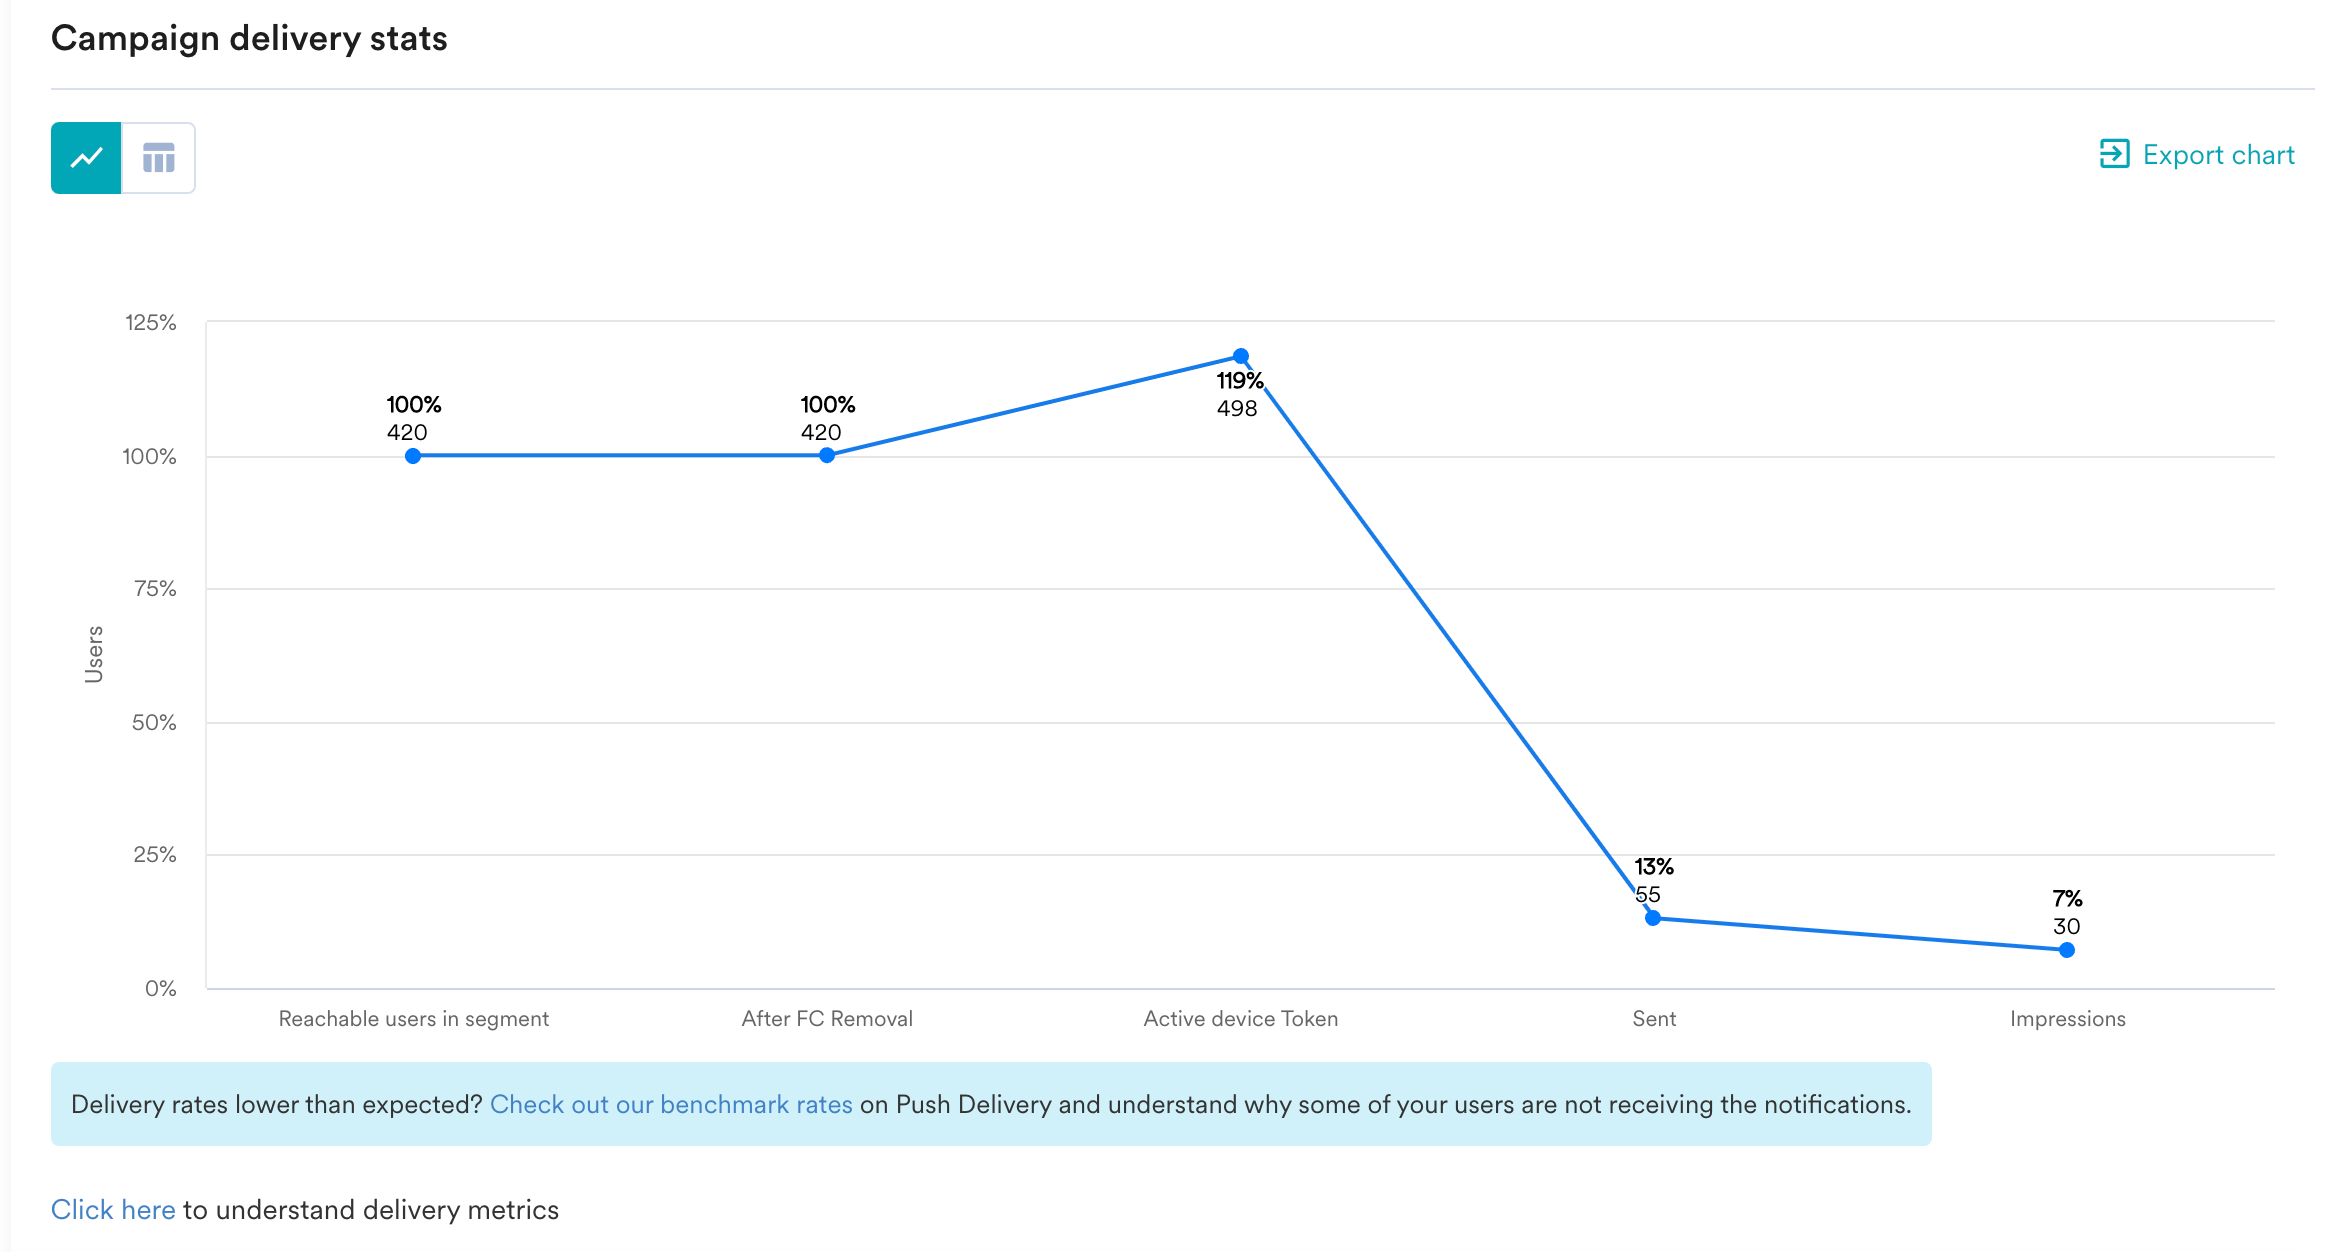
Error breakdown
This section details the number of campaign delivery failures and their reasons. For more information, refer to Troubleshooting Common Push errors.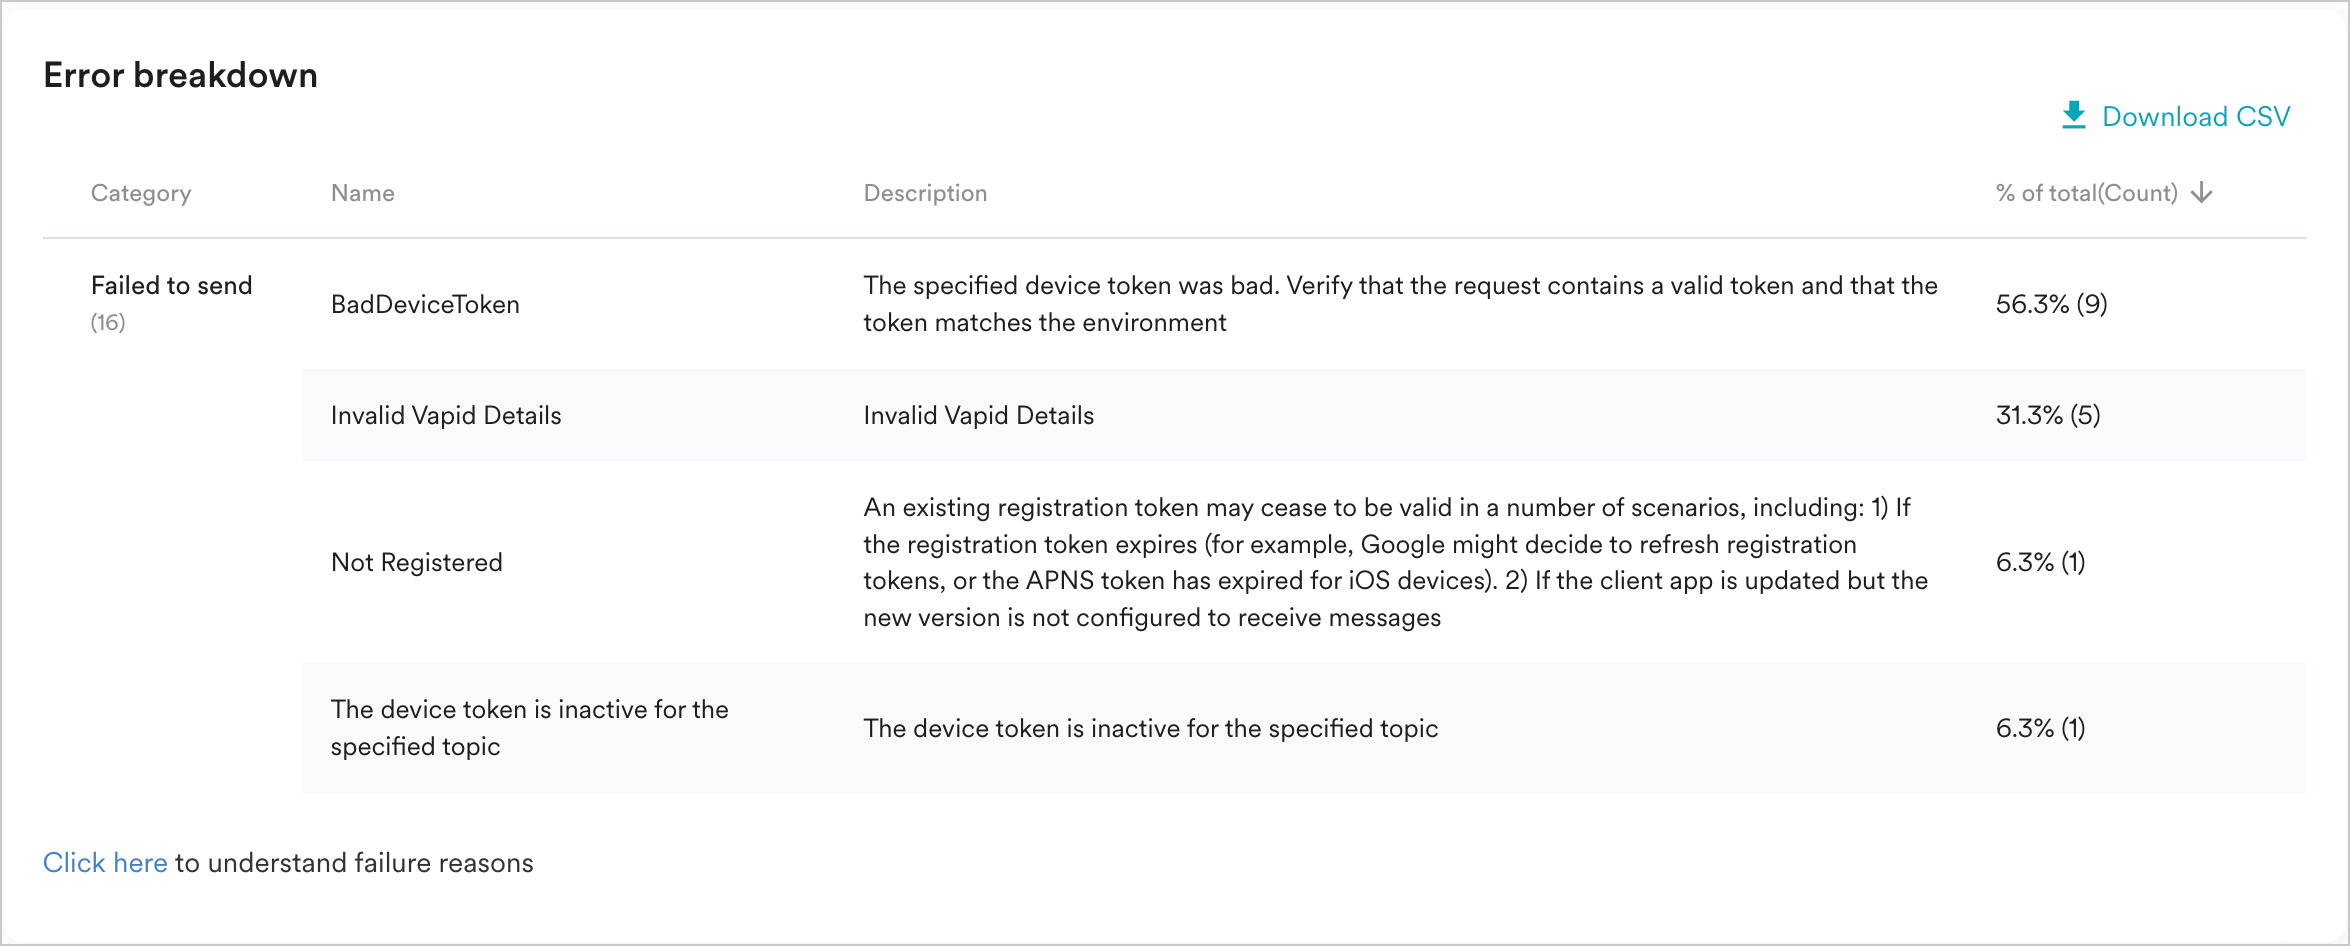
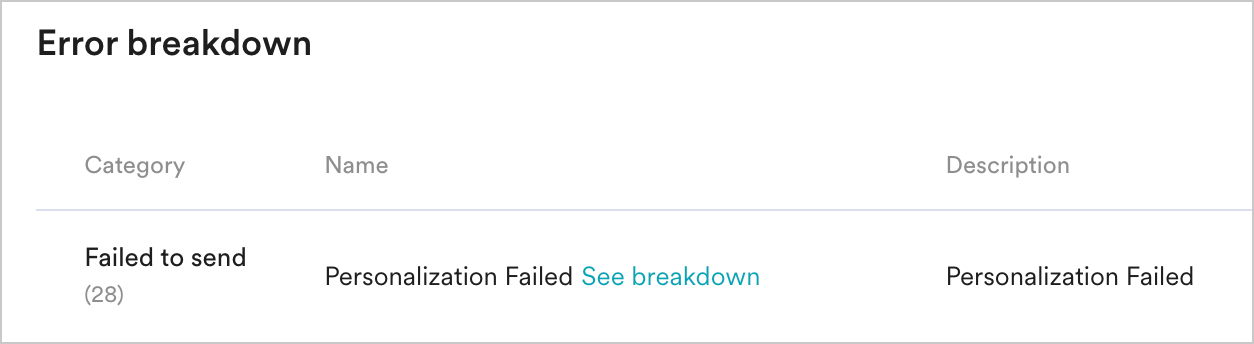
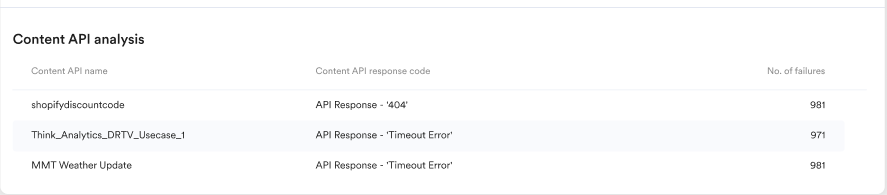
If the Content API being used in the campaign does not provide a 2xx/successful response, campaigns might still be delivered if the empty response has been handled in your JINJA code added in Step 2 of Campaign Creation (the content/message creation step).
Best Time to Send
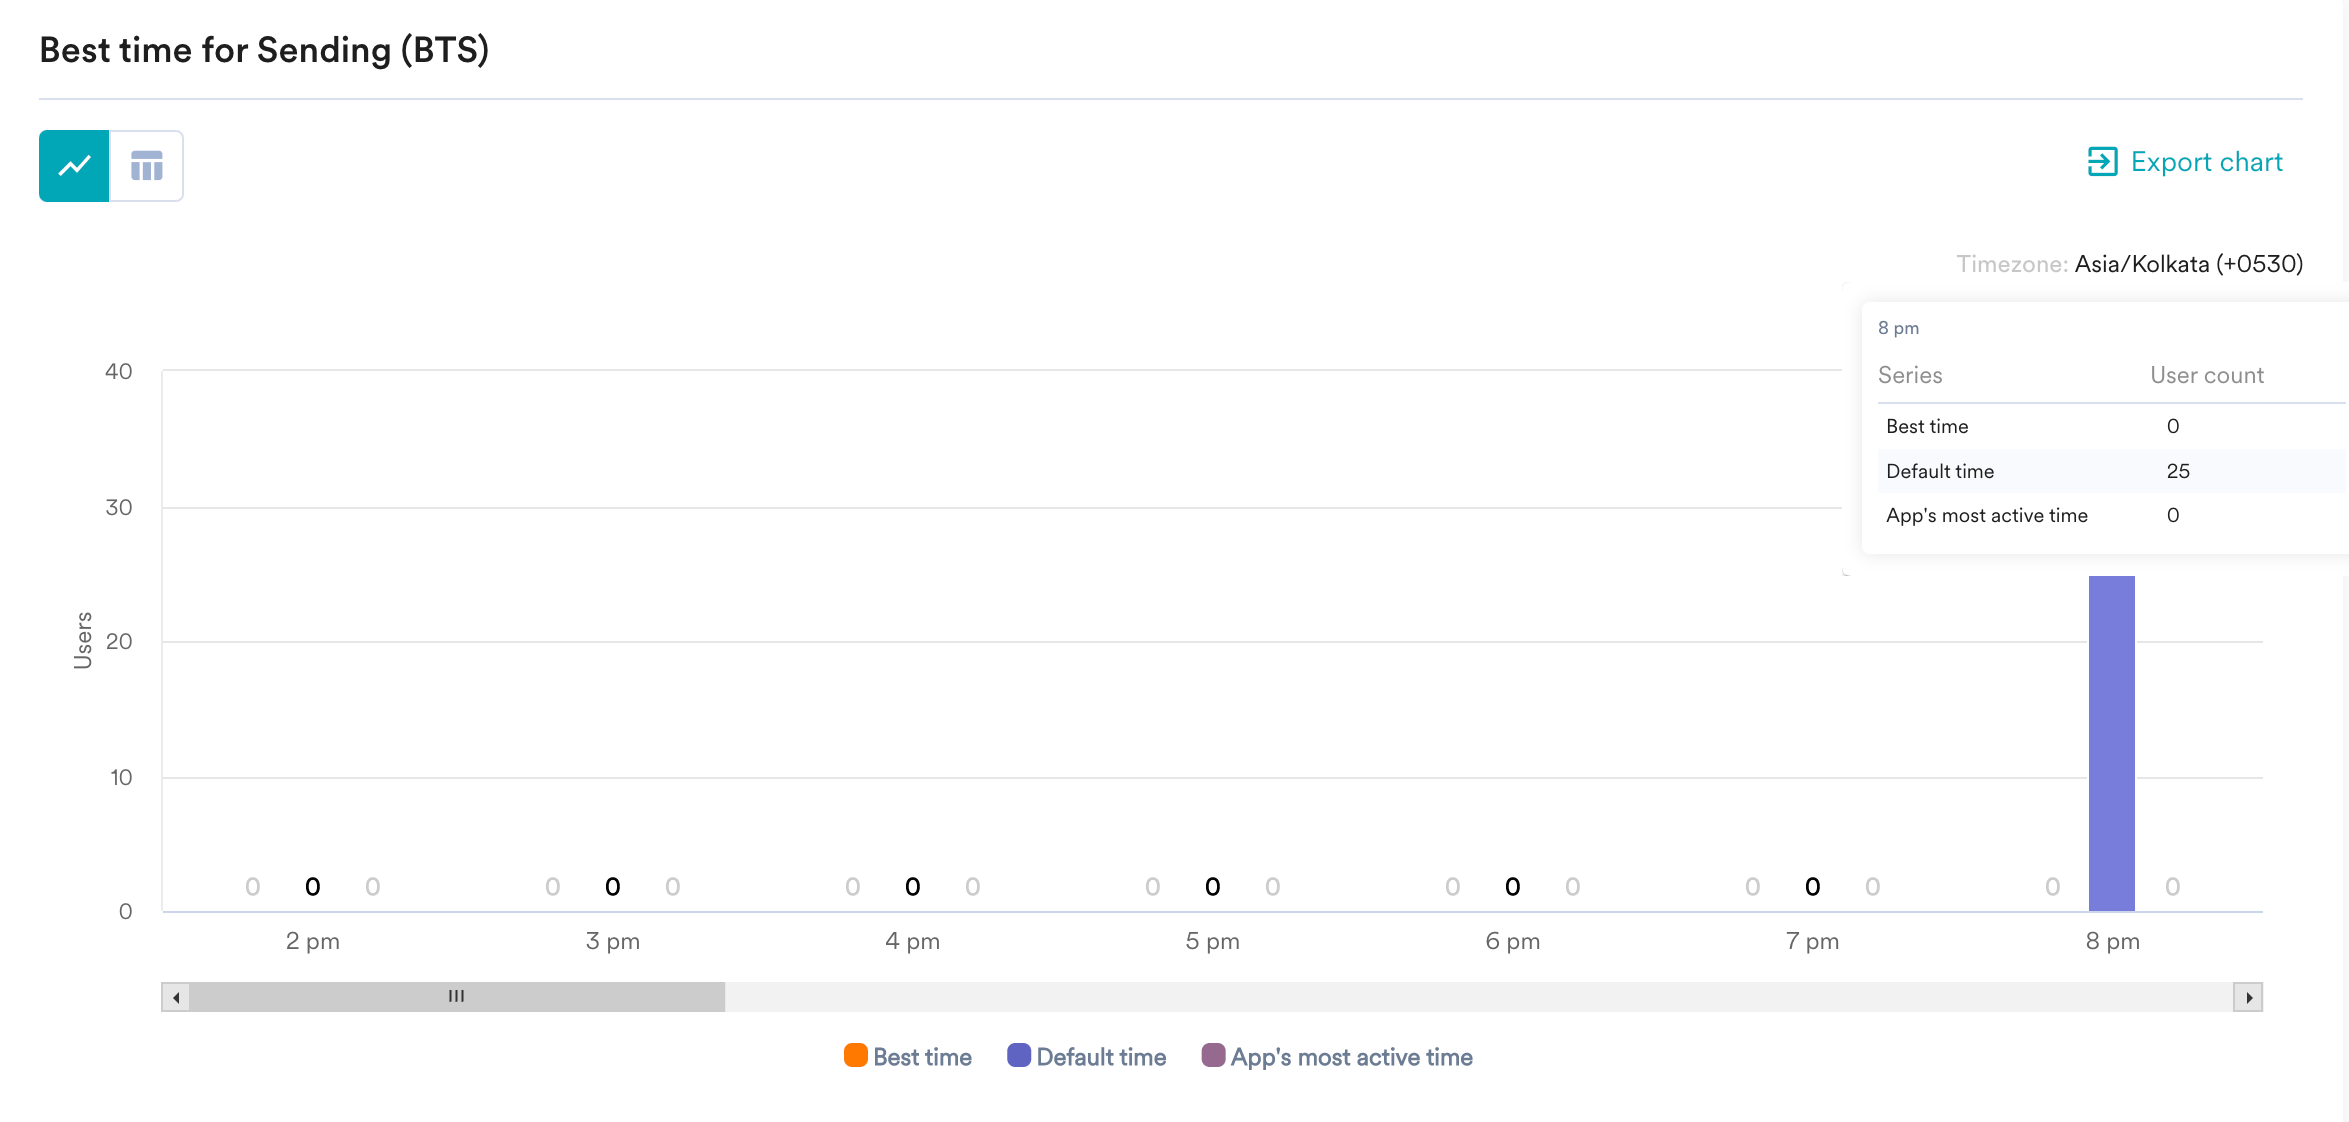
BTS campaigns use MoEngage’s Merlin AI to estimate the best time to deliver a push campaign to a specific user based on their past engagement trends. For more information, refer to BTS. This section showcases the stats for users for whom the campaign was delivered at the following times:- BTS
- Default time
- App’s most active time
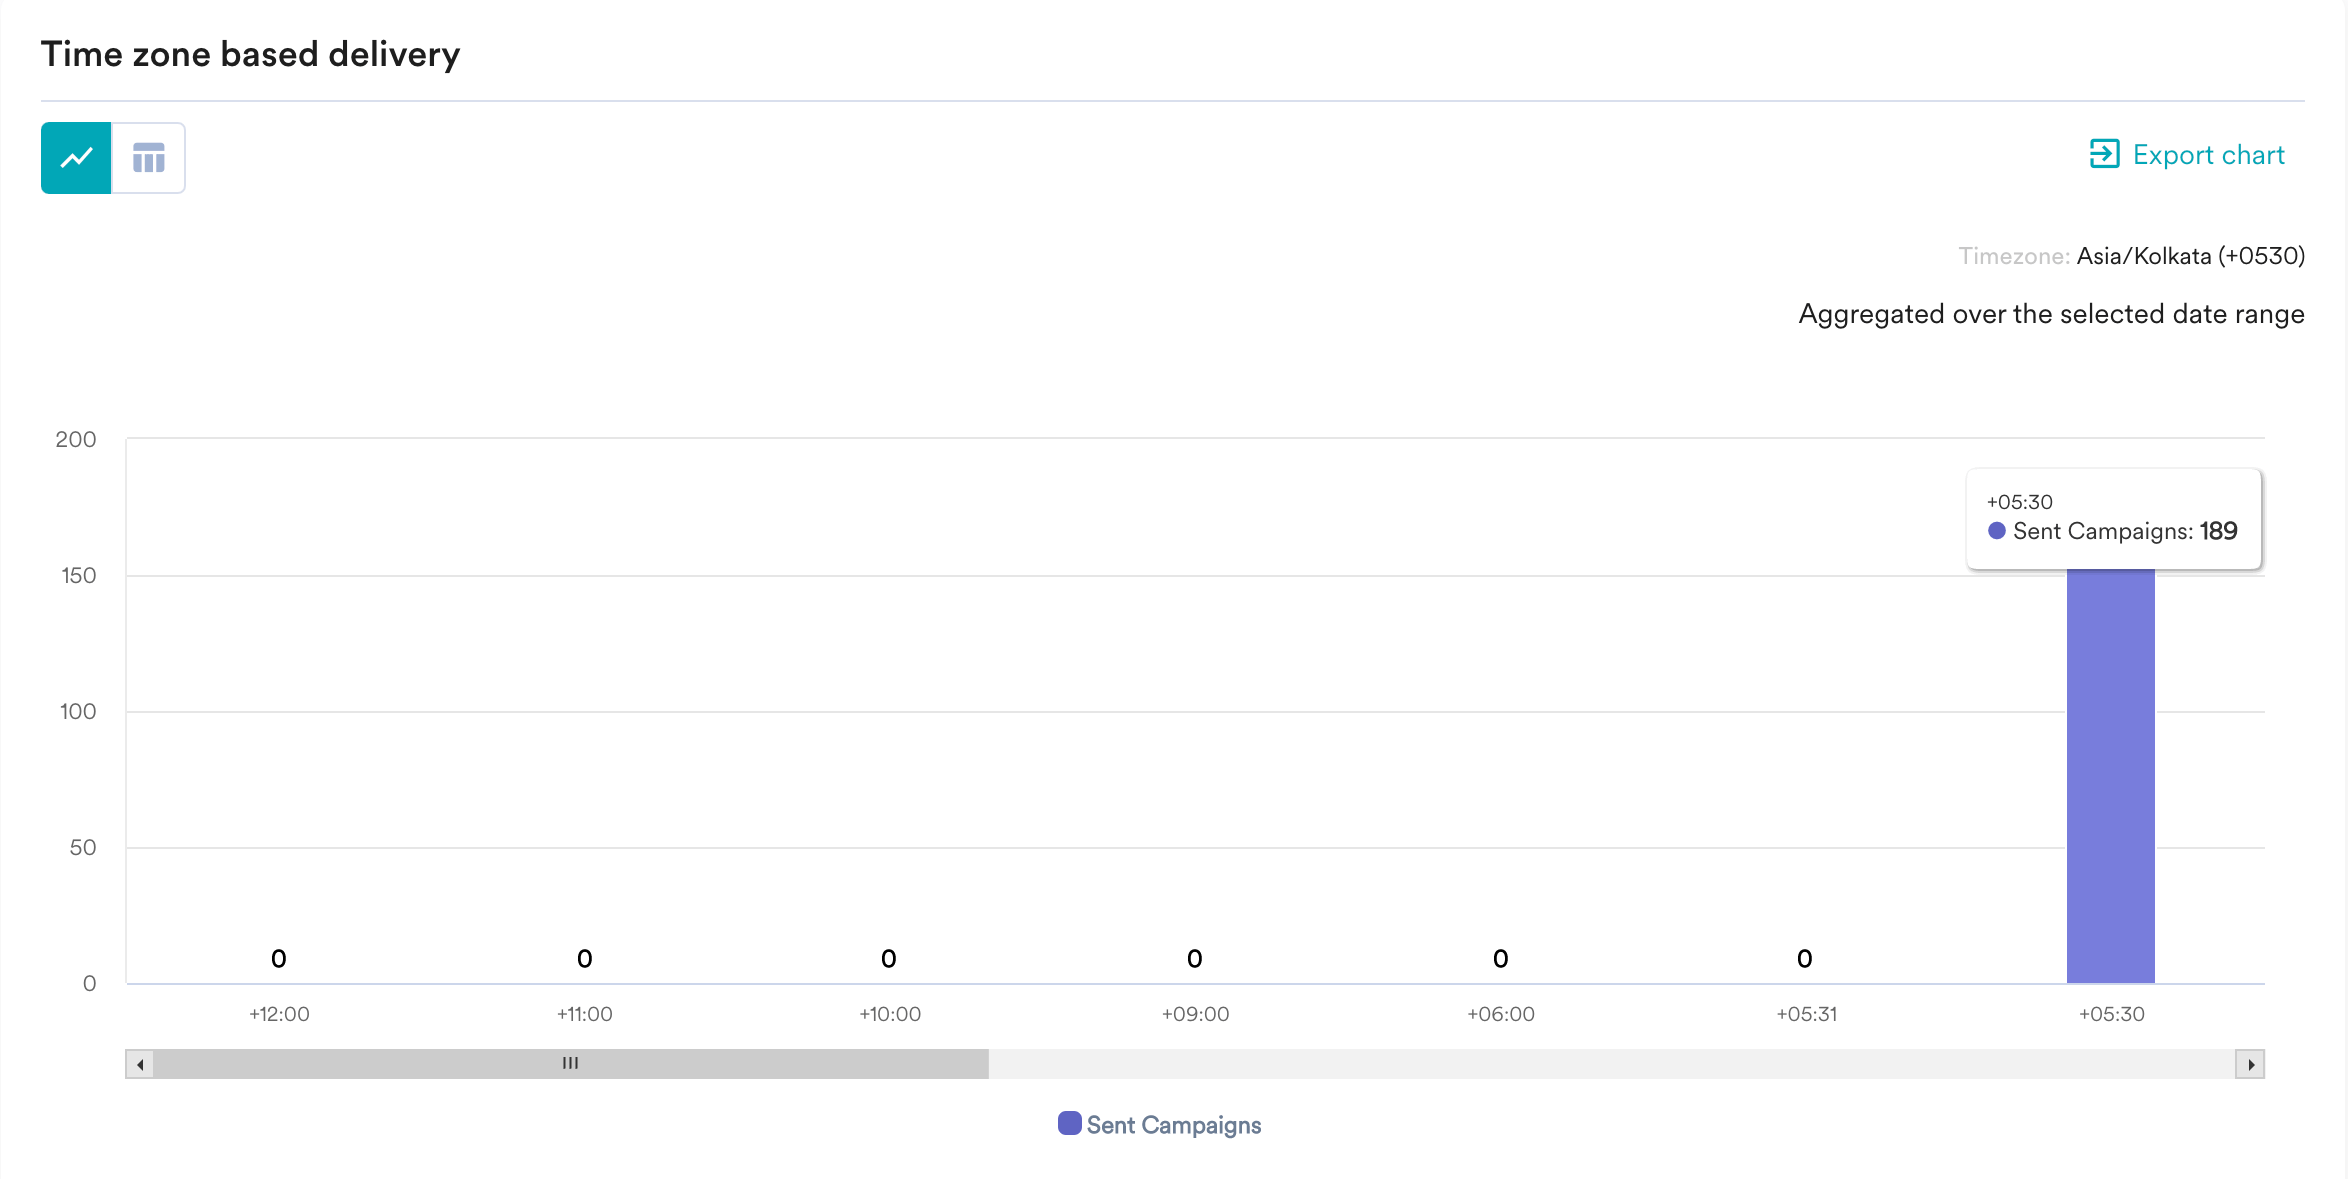
Time Zone Based Delivery
This section showcases information about the timezone in which the campaign was sent to the users. The following information is available:- The number of users for whom the campaign was sent in their app’s timezone
- The number of users for whom the campaign’s default time zone due to time lapse
Campaign Info
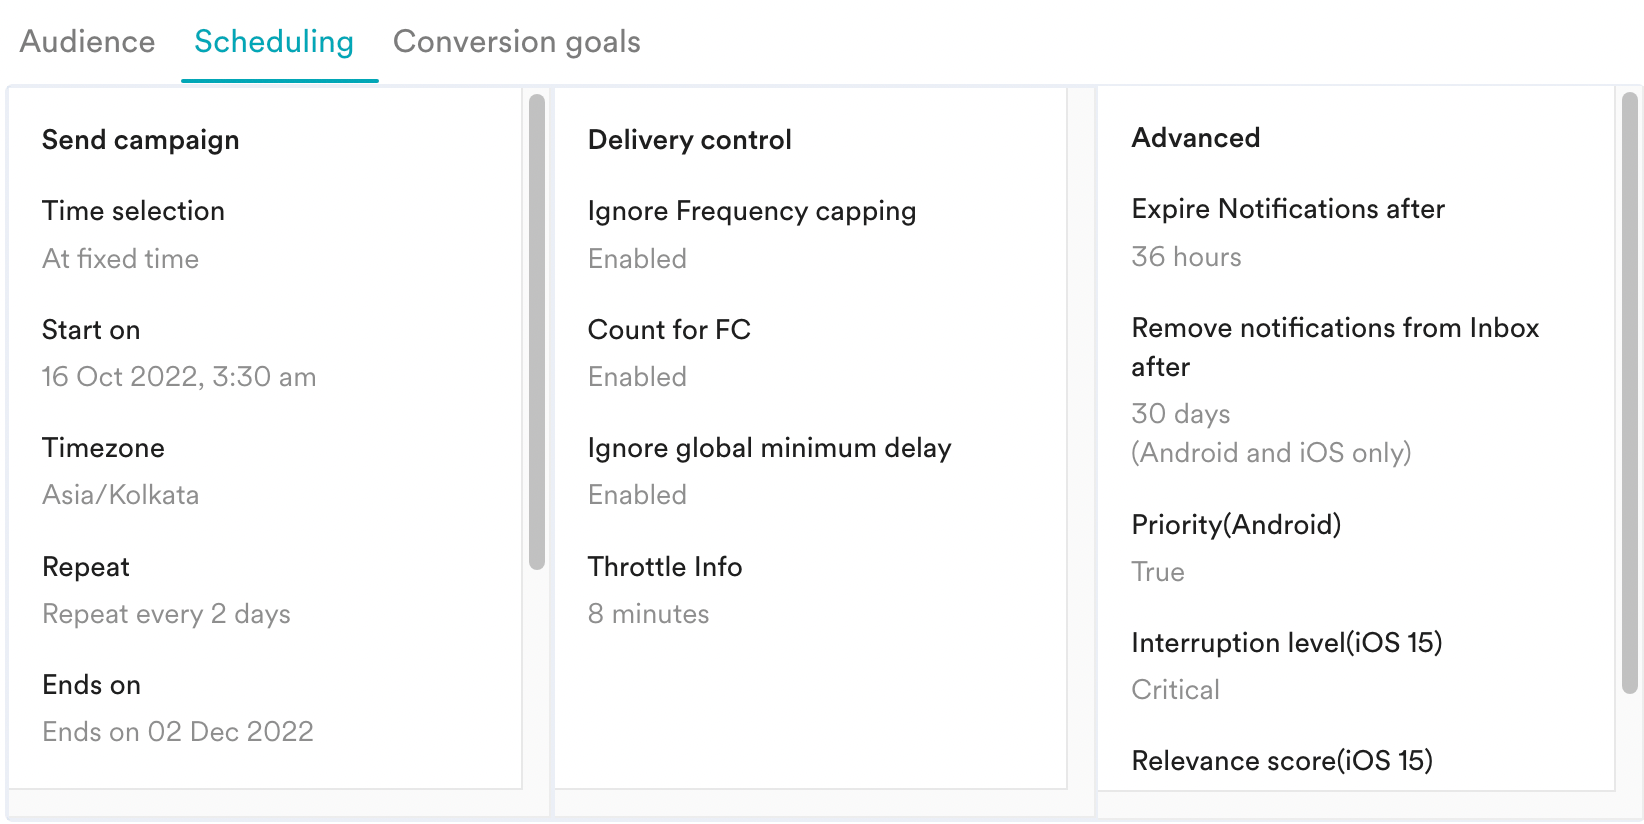
You can view the information about the campaign sent using the Campaign Info tab.- Timeline
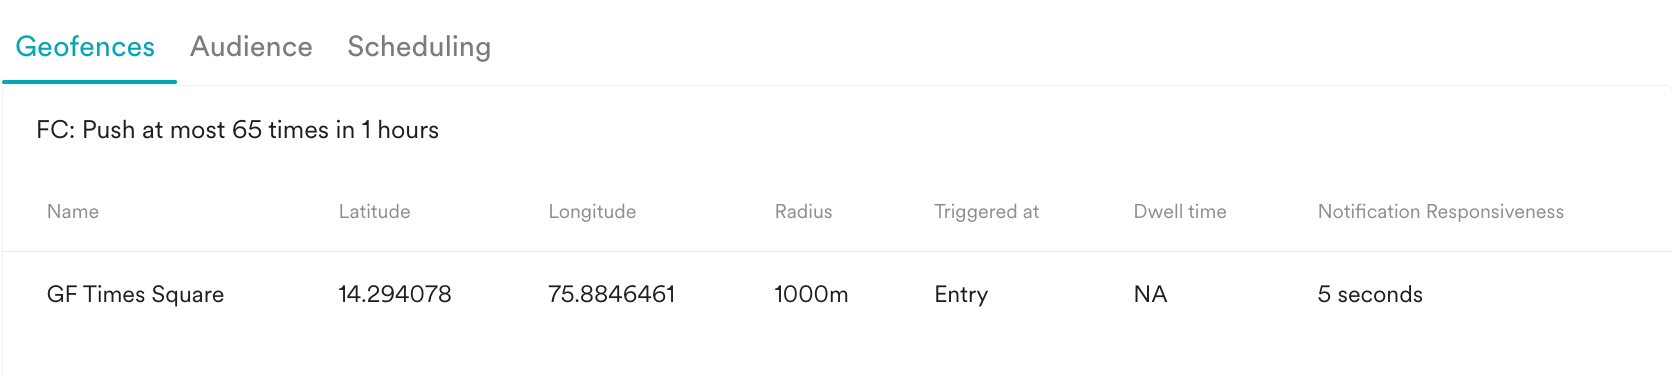
- Geofences
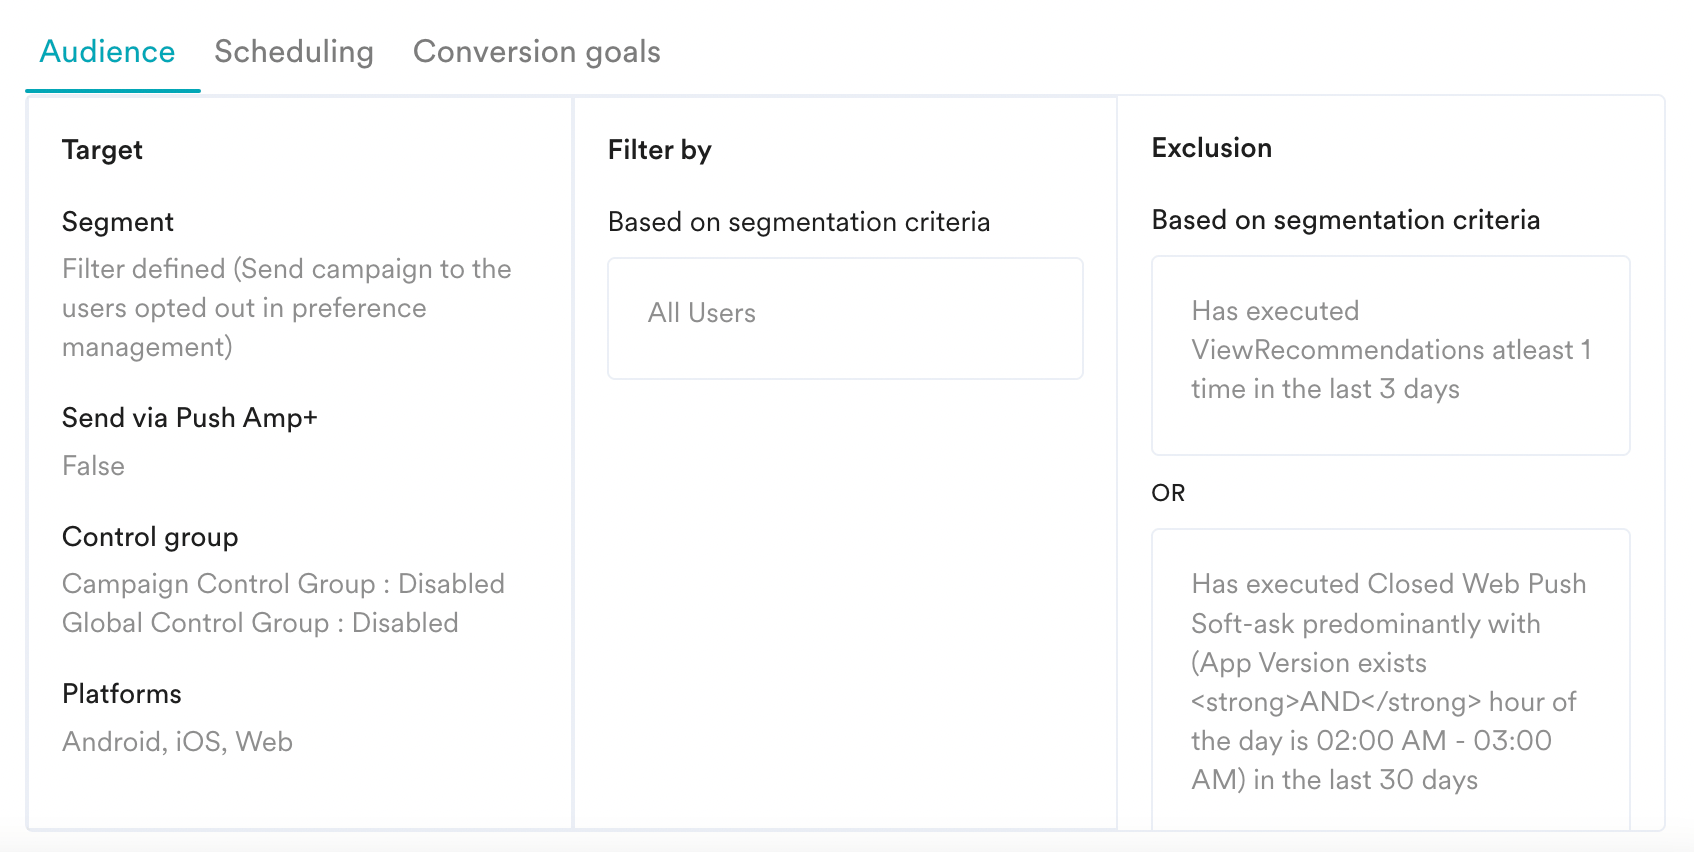
- Audience
- Trigger criteria
- Scheduling
- Conversion Goals
Timeline indicates the time taken for various stages in publishing the campaign and gives a view of the current state of the campaign. This section is available for One Time and Periodic campaigns and contains information about the following: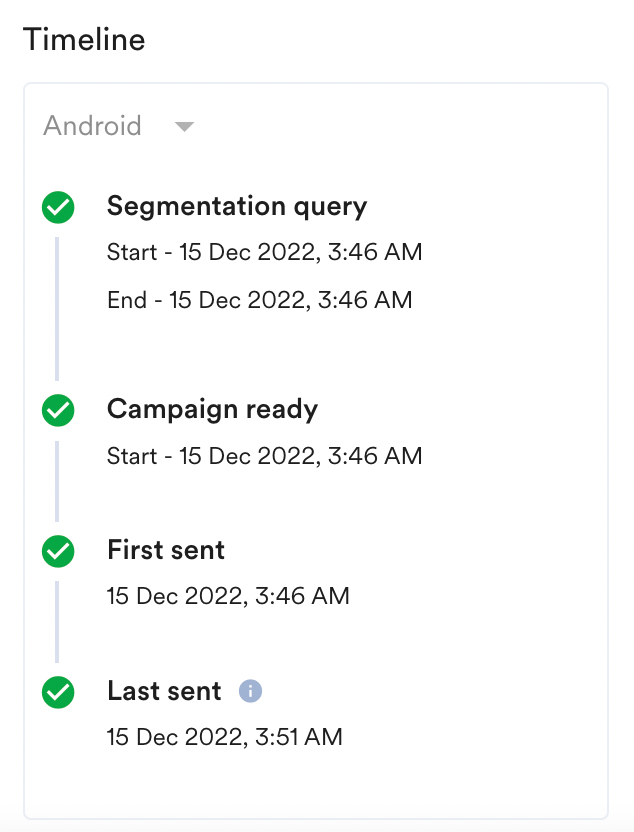
- Segmentation Query - contains information about when the segmentation query was started and when it was completed.
- Campaign ready - contains information about when the campaign was ready to be sent out from MoEngage post the required internal processing. For ASAP campaigns, this time will represent the campaign sending time. For scheduled campaigns with Pre-compute selected, this will differ from the campaign scheduled campaigns.
- First sent - contains information about when the first batch of notifications was sent from MoEngage and when the first message or notification was sent.
- Last sent - contains information about when the last message or notification was sent for the campaign.

Preview and Content
This section contains information about the message template, click actions, and content defined for the notification content during the second step of campaign creation. You can also preview the notification as it would be rendered on the user’s devices for the chosen platforms.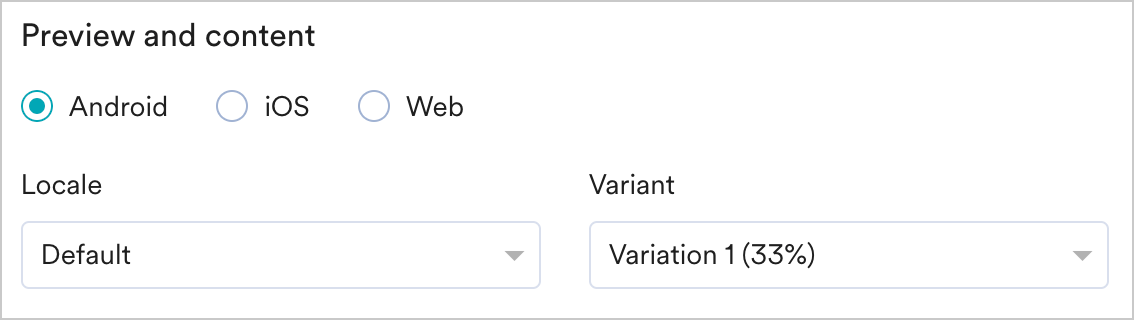
- Locale - You can preview the notification for the various locales added.
- Variation - You can preview the notification for the variations added. Basic details include template type, message title, message, summary, click action, redirect URL, and so on.
- Advanced details such as whether auto dismiss or timers are included in the message, badge count, badge image, and so on.
- Collapsed Mode
- Expanded Mode
- Dark Mode
- Light Mode
Campaign Events
Campaign events may not match with the campaign stats because of the different methods with which they are calculated.
* These events are available as a paid add-on. To request enablement of these events, please contact your MoEngage Customer Success Manager (CSM) or the Support team.
The events Notification Dropped, Notification Failed Android, Notification Failed iOS and Notification Failed Web contain additional attributes to help identify the reason why a notification was dropped or failed as seen below:
- Reason group - Defines the category of the reason why this notification was dropped or failed.
- Reason - Describes the specific reason why this notification was dropped or failed as seen in the failure breakdown table on the Campaign Info page.
- Code - Gives a specific non-changing code for the reason.
All MoEngage AI products, which were previously referred to as Sherpa AI, are now known as Merlin AI.